For a few years now, data has been revolutionizing the way businesses make decisions. When you are trying to solve complex business scenarios, relying on data will help you thrive by providing answers based on accurate information instead of simple intuition.
Throughout this process, you will be able to go beyond what happened to understand why something happened in the first place. In time, you will increase operational efficiency, enhance your decision-making process, offer an excellent service to your customers, and hence, score a substantial advantage over competitors.
While this all sounds incredible, it doesn’t happen overnight. To achieve a successful data analytics process, there is a journey you need to follow. One that requires time and effort as well as the right set of tools. Here we will cover the analytics journey in detail to help you get started.
According to datapine, one of the leading providers of business intelligence software from Germany, there are 6 key steps to achieve a successful analytics process. These are connect, explore, visualize, predict, share, and monitor. Let’s look at each of them more in detail.
1. Connect

The first step in your analytical journey will be to connect all your data sources into one unique location. Businesses gather data from several internal and external sources to extract the insights they need to thrive. For example, to get a 360-view of your clients you need to combine data from sources such as CRM applications, website traffic, social media, sales behaviors, just to name a few.
This process, also known as data integration, makes your life easier by unifying all your sources in one place. Without this step, you would need to constantly log in to multiple accounts, extract your information, take care of cleaning and reformatting, all before you could start actually analyzing. There are various tools out there that offer swift data integration with just a few clicks and almost no manual work.
2. Explore
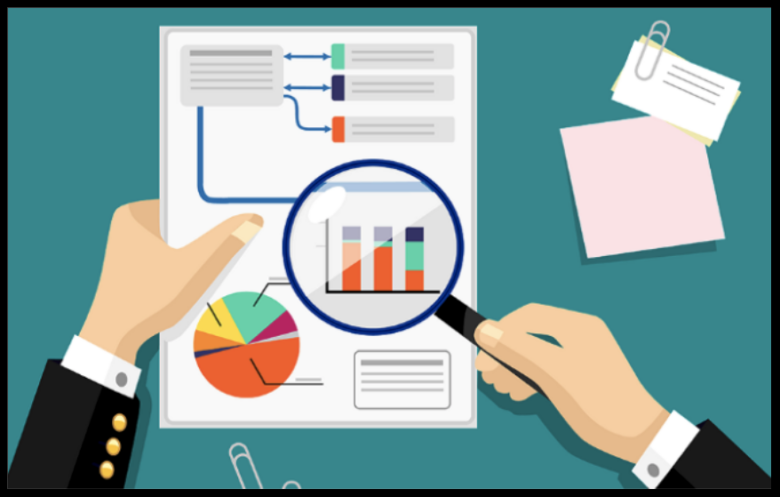
The second step is data exploration. At this stage, you start making sense of the data that is available to you. You explore the information to find trends and patterns that will help you answer critical business questions. Essentially, this step is where you dig deeper into large volumes of data to better understand the next steps in your analytics process.
Traditionally, data exploration was thought of for professional data analysts. However, with the rise of self-service BI tools, anyone can play the role of a data analyst without the need for prior technical skills.
3. Visualize

It is no secret that the human brain processes visual information way faster than text or numbers. In fact, as stated by icsid, it takes the human brain 13 milliseconds to process an image, which leads us to the third step of the analytical journey: visualize your data.
Traditional means of data visualization include Excel charts or PowerPoint presentations. The issue with them is that they provide a static view of your information making it hard to dig deeper for useful insights. To avoid this, modern analytics tools offer interactive dashboards.
These visually appealing analysis tools offer a centralized view of your data in real-time, allowing you to filter through the information and extract relevant insights that would otherwise remain untapped. And not just that, modern dashboards are intuitive and easy to use, making them accessible for any type of user.
4. Predict
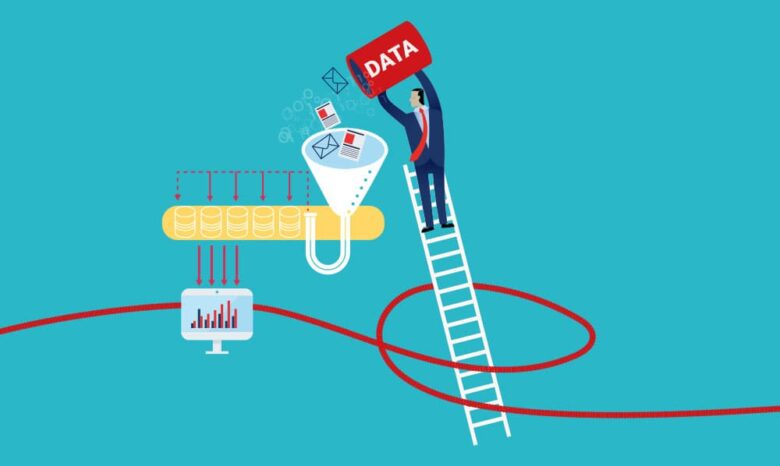
This next step allows you to take your data even further by using predictive analytics technologies. Powered by statistical algorithms and machine learning, you can go further from knowing what happened in the past to know what will happen in the future. By analyzing your current and historical data, you can find trends and patterns to generate accurate forecasts about your future performance.
Today, more and more businesses integrate predictive analytics into their journey as it allows them to stay one step ahead of future developments. For example, you can predict the number of sales at a specific time of the year and prepare production and marketing actions in advance.
5. Share

No matter the business size, involving every relevant stakeholder, department, and function in the analytical process is a critical step to success. But just involving them is not enough, you also need to make sure they are constantly on the same page regarding the progress of different activities and actions. To ensure that communication is flowing across the business, you need to think about different sharing options.
For instance, various business intelligence tools offer the possibility to share your analytics reports in multiple formats such as Email, a URL link, mobile app, embedding them, just to name a few. This will allow your analytics journey to be efficient thanks to enhanced communication between key players.
6. Monitor

By this point, you’ve probably collected substantial amounts of data from various touchpoints. Now, you reach the stage where you need to monitor your data closely to extract the needed insights. Tracking everything manually is a tedious task, not to mention that is prompt to human error.
There are various technologies that assist you with this stage. Artificial intelligence (AI) algorithms such as neural networks can help you spot patterns in your data and notify you as soon as any anomaly occurs. You can also benefit from automation features that will generate your reports automatically, avoiding a substantial amount of manual work and allowing you to interact with real-time data on the go.
By following each of the steps in the analytical journey you will set yourself to extract the maximum potential out of your data. Implementing analytics into your company’s DNA will empower every employee and relevant stakeholder to question its decision-making process and dig deeper to find improvement opportunities and ensure success.
An important thing to remember is that all of this can only be achieved with the help of the right tools and technologies. Before investing in one you need to think about your business’s general needs and goals, pricing, user interface, integration, among others.


