Learning how to build wealth through stocks, shares and other investments is a complicated process. Not only is there a lot to learn when it comes to things like methodology, but you also need to figure out what endless phrases and terms mean too.
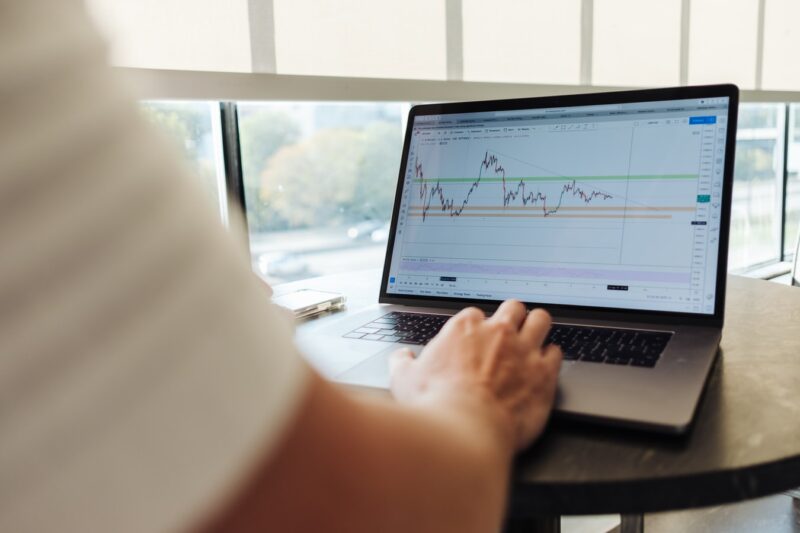
For instance, if you’ve ever seen someone on your cryptocurrency forum posting charts with tons of lines and waves on them, then you might be aware of what a technical analysis is. Just like in the Forex and stock markets, technical analysis is a powerful tool for providing a deeper insight into what could happen next. This strategy aims to understand the market sentiment behind trends in price by looking at patterns in the industry.
Using Technical Analysis for Cryptocurrency

Companies like easyMarkets, which offer cryptocurrency CFD trading, also provide access to technical analysis, so that traders can study the statistical trends on historical price and volume data that might highlight valuable opportunities. These analysts learn how to recognize the red flags and options in price movements.
This kind of market evaluation works because it uses information gathered in the past to predict potential opportunities in the future. You might see an uptrend that suggests that an asset is constantly raising in value, or a downtrend that might indicate it’s time to sell before a loss becomes too great. Often, it can take a lot of training and strategy to effectively use technical insights in the cryptocurrency market.
That’s because whereas many industries do repeat history in the way that asset prices fall and rise, crypto is often very unpredictable. You may find that you need to use advanced technical tools, like bullish and bearish candles – similar to the strategies commonly used in Japan during the 1700’s. If you’re not sure what candle markets look like, now could be the time to do some research before you take the next step in your spending plan.
Examining Technical Reports

A chart of volume and price that shows all the past decisions taken by participants of the BTC or crypto market can influence your decisions in two way. On the one hand, there’s a psychological impact, as what you did in the past and how it played out will often affect how you approach situations in the future.
On the other hand, some traders start to identify patterns more easily when they look at charts and reports regularly. When trends start to show, you can act accordingly, by selling or buying according to the knowledge you already have. If a large number of people are following the same strategy, then it’s likely that the market will be sustained in the right direction.
Doing a technical analysis of a particular coin will help you to read the market. However, there’s a lot of work involved. You need to examine price charts and graphs in a host of ways, looking for a consensus within the information that you gather. The idea is that the more information you collect, the more confident you will be making predictions on where the market is headed.
Common Points to Consider in Technical Analysis

Before you dive into a technical analysis for any trading strategy, it’s worth noting that no one can know for certain what’s going to happen in the future. Your evaluation of the market will simply show you what has happened in the past, so you can make informed decisions about similar situations. However, nothing is certain. With that in mind, let’s take a look at a few of the elements that you’ll come to know as you continue your education in this industry:
- Candlesticks: Candlesticks are the rectangular objects on a chart which often appear in green or red. These have lines coming out of the top or the bottom, which make them resemble a candlestick. The rectangular part of the image shows the gap between the opening and closing balance of a currency during a specific period. If the block is green, then the button of the rectangle will be it’s opening price, and the top will be where it closed. If the block is red, it’s the other way around. The wick at the top or bottom of the candle demonstrates how much additional growth there is likely to be.
- Volume: Volume comes in the form of literal sales, and dollar volume. The literal amount is the number coins traded that day. This often shows at the bottom of the chart you’re looking at. The larger the volume is, the more volatility you’re likely to see in the price of a specific asset, because more people are buying and selling. Looking at this particular metric can show you how bullish or bearish your market is.
- Moving Averages: Looking at candlesticks over short amounts of time is helpful, but you also need to consider the movement of certain coins across longer periods tool. There are Simple Moving Averages, and Exponential Moving Averages to consider. The SMA is pretty basic- demonstrating the average closing price over a certain time. The EMA, on the other hand, is a little more complicated. The graph often has different weights to it depending on when you’re conducting your analysis.
Using Technical Analysis

Using the information that you collect from the common components discussed above, it’s possible to evaluate larger trends in your industry or environment. The more time you spend examining the industry, the easier it will be to understand which directions coins are moving in, and where you should buy or sell.
Like with most trading strategies, it takes some practice and learning to become a true pro. Learning how to use this technique effectively takes a lot of time and effort, however. You’ll need to understand the difference between uptrend, downtrend, and sideways trending markets.
What’s more, you’ll also need an insight into the concepts of resistance and support, which might affect the way you spend your money on certain coins. The more time you spend evaluating the industry, the more comfortable you’ll feel using technical insights to make decisions.


